The Numbers Disagree
Finance, product, and marketing each report revenue their own way, and the meeting stops being about the decision.

Analytics is not a dashboard nobody opens. It is the shared definition of what your business counts as true.
Turn scattered product and operational data into one set of numbers your teams act on without arguing about them first.

10+ Projects Delivered
Warehouse-Native Modelling
Most teams do not lack data. They lack agreement on what it means, and every new source makes that disagreement more expensive to settle.
Finance, product, and marketing each report revenue their own way, and the meeting stops being about the decision.
Events, exports, and third-party tools land in separate places, so a simple question turns into a week of manual joins.
A report built for one launch keeps rendering long after the metric behind it stopped being maintained.
When a number is slow to arrive, the call gets made without it, and the analysis becomes an explanation after the fact.
A renamed button drops an event, and nobody notices until the funnel already has a month-long hole in it.
Analytics that follows the data from the moment it is captured: instrumentation that holds, a warehouse that models it once, and reporting the business reads without a translator.
The short list of metrics that actually move decisions, defined precisely enough that two teams calculating them separately arrive at the same answer.
A tracking plan tied to the product and implemented in code rather than bolted on through a tag editor, with checks so a release cannot silently break the funnel.
Sources loaded once and modelled into tables analysts can trust, with tests that fail loudly when something upstream changes shape.
Reporting built for the person reading it, with filters that answer the obvious follow-up question instead of prompting a request for another chart.
Activation, retention, and drop-off measured on real cohorts, so a change in the product can be traced to a change in behaviour.
Live views of the metrics worth watching during the day, with alerting set at the thresholds that justify interrupting someone.
Freshness, lineage, and access control that make a number defensible — where it came from, when it last updated, and who is allowed to see it.
We begin with the decisions you are trying to make, then work backwards to the metrics that inform them and the data needed to produce those metrics honestly. From there, analytics becomes a clear sequence of definitions, pipelines, models, and reporting people use.
How Can We Help You
See how defined metrics, honest instrumentation, and reporting people actually open turn scattered data into decisions teams can defend.
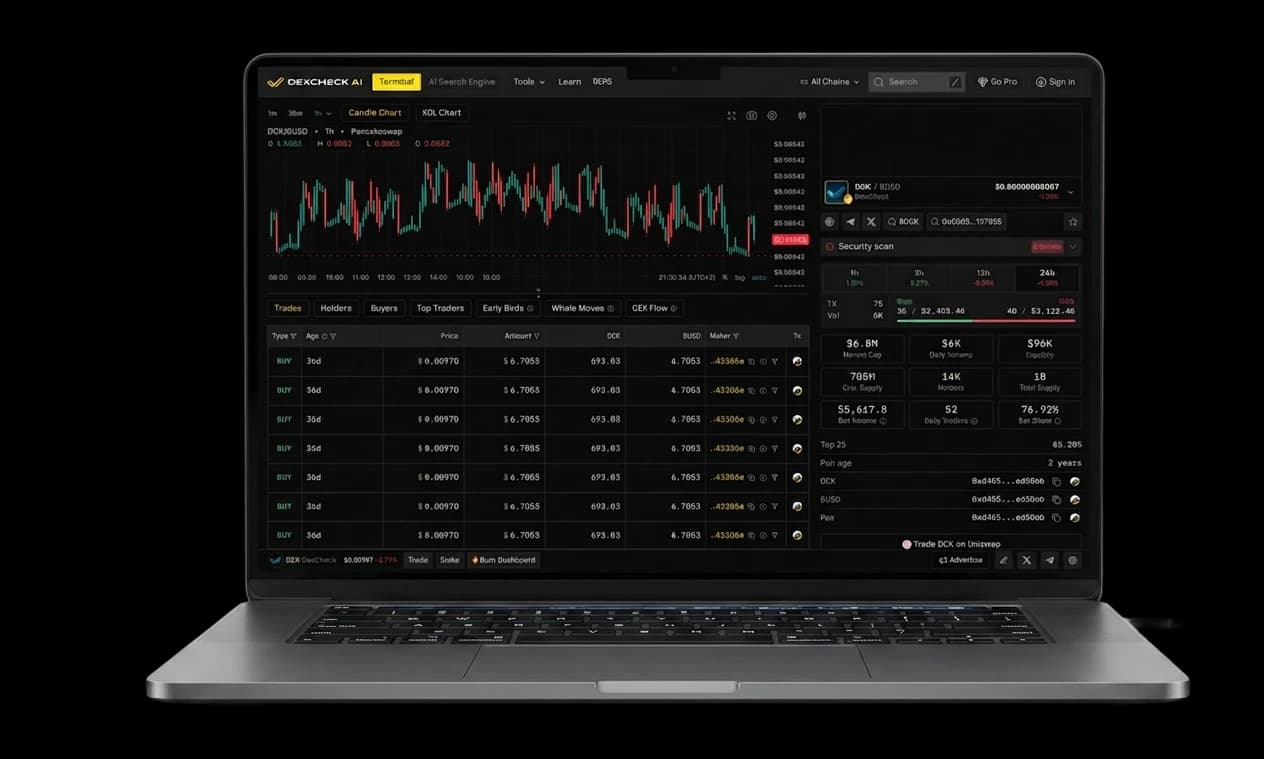
A multi-chain analytics platform that turns fragmented blockchain activity into decision-ready market intelligence.
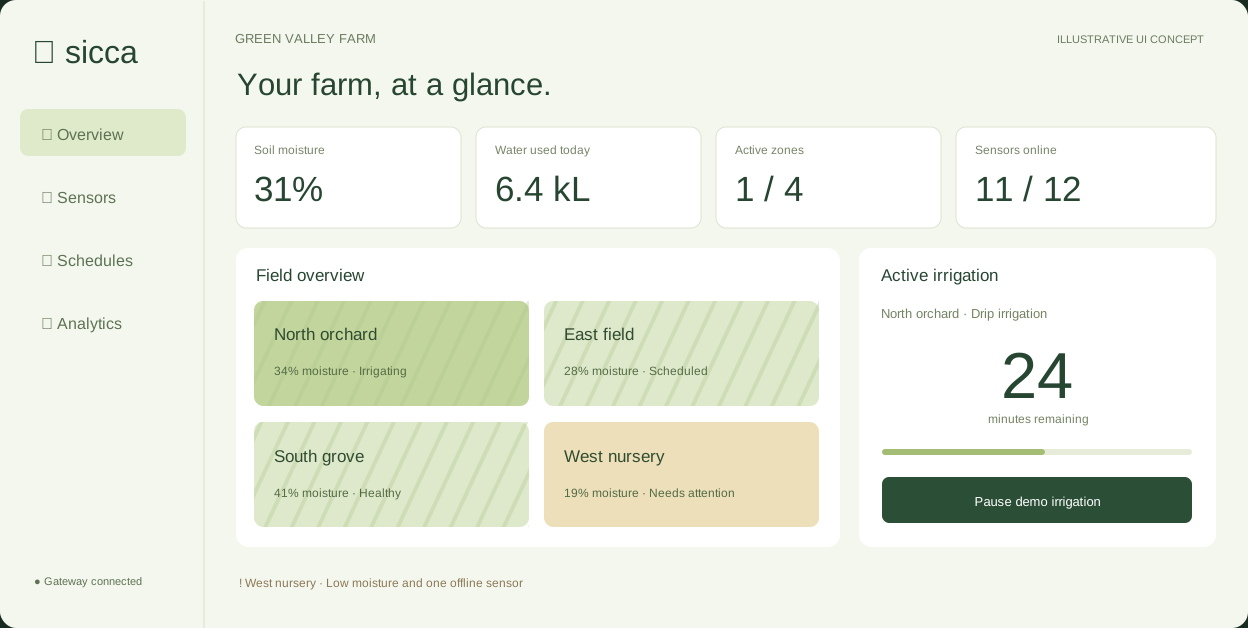
View Case Study ↗A modern irrigation product concept connecting field sensors, plot health, automated watering, and farm analytics across web and mobile.
View Case Study ↗
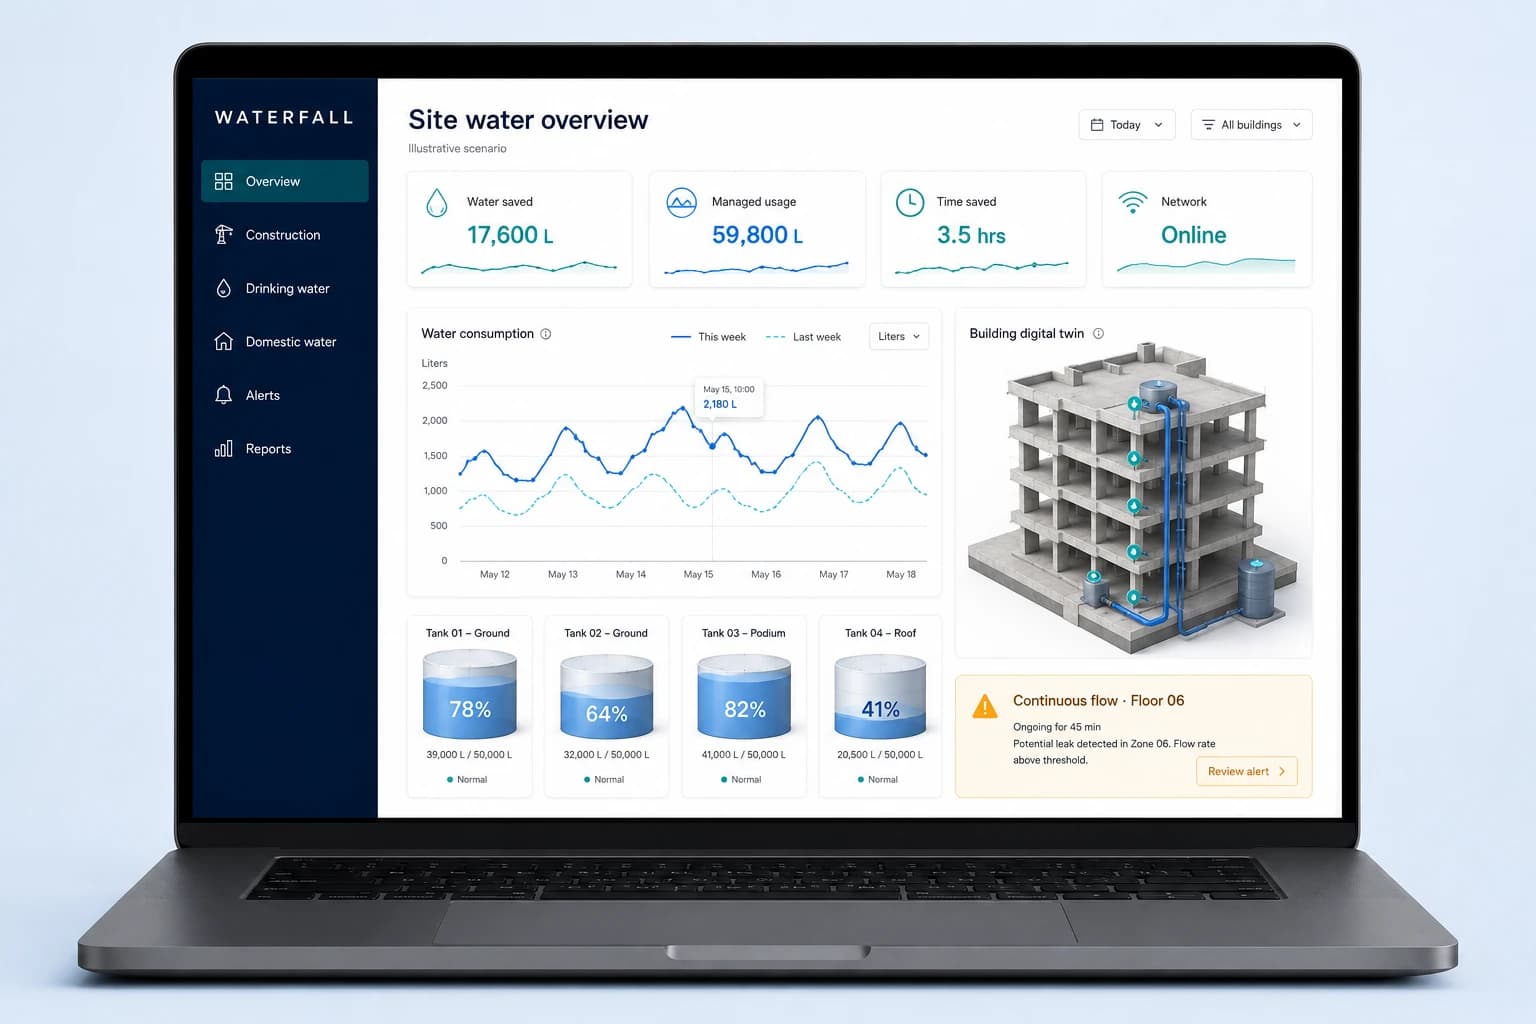
Connected site water operations: IoT sensors, cloud monitoring, and valve control across construction, drinking, and domestic water networks.
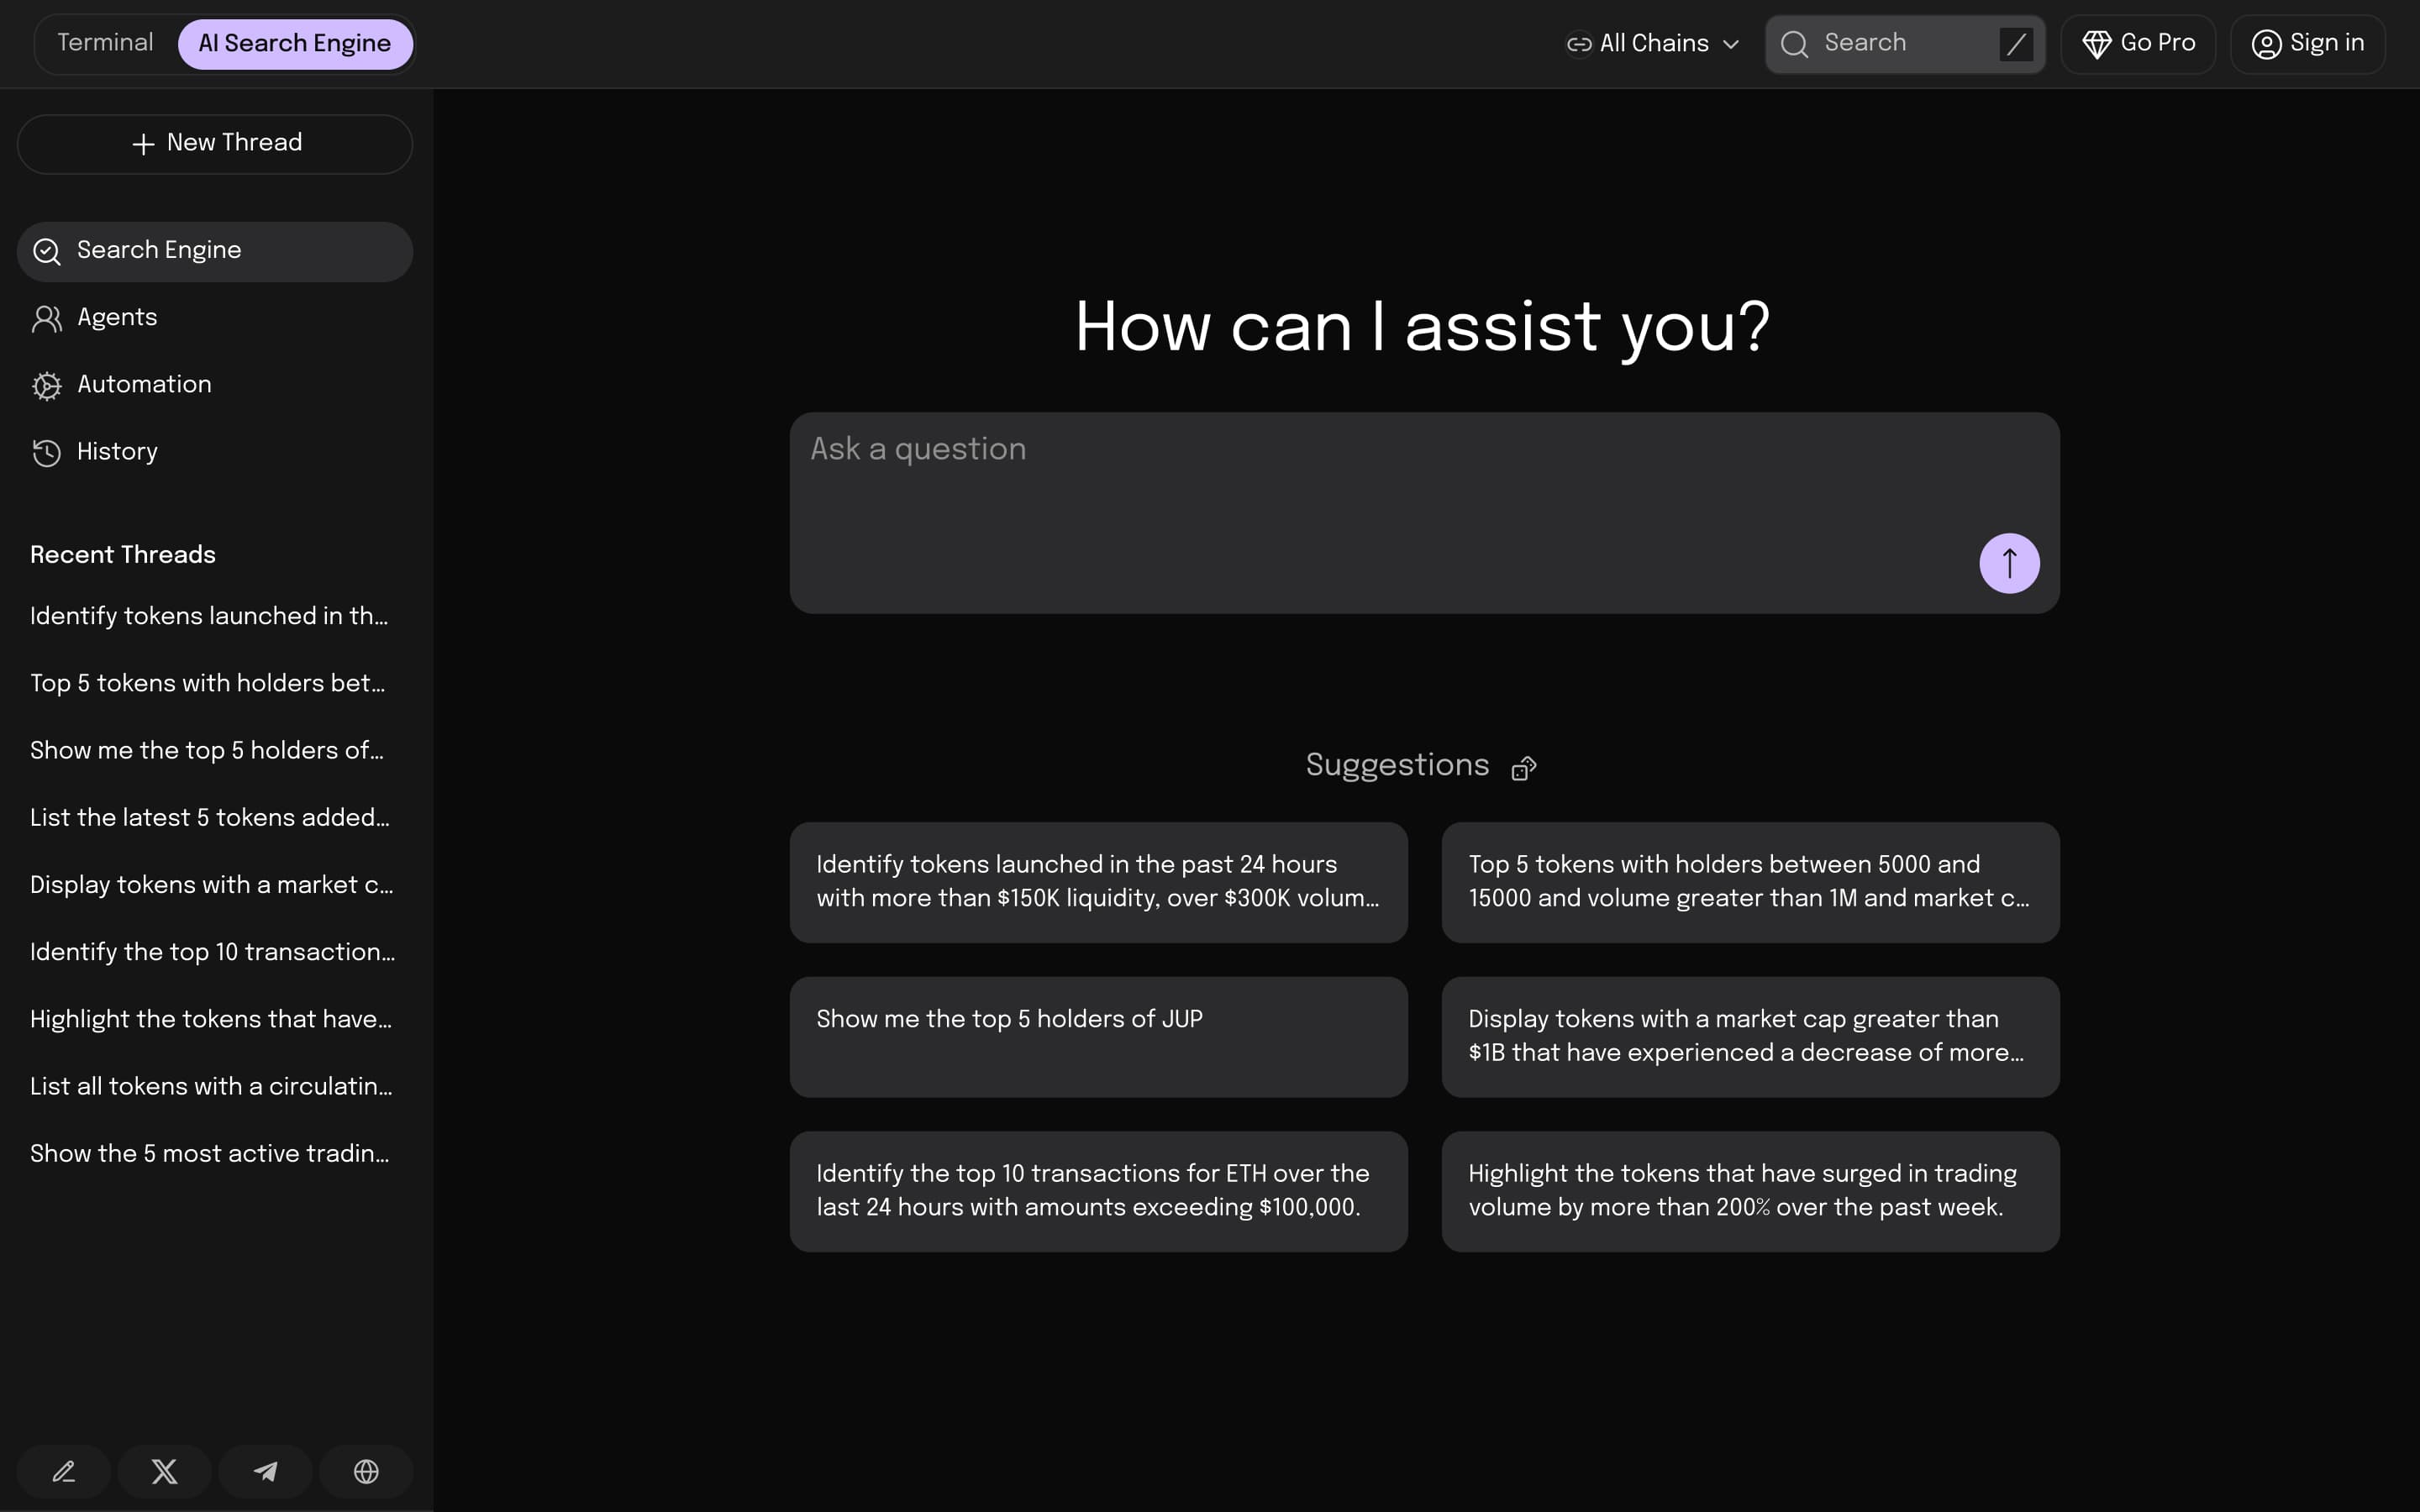
View Case Study ↗Conversational onchain research for wallet PNL, token analytics, top traders, and market movers across multiple chains.
View Case Study ↗Let's turn your institutional vision into a digital reality. Book your strategy session today.
Book a Strategy SessionContact Us
Reach out to us:
Mail us @
[email protected]Someone from our team will reach out in the next 24hrs, we look forward to the conversation